Rural Development Policy in Figures
RDP Monitoring Indicator Tables
In every Member State the Managing Authority and the Monitoring Committee monitor each Rural Development Programme (RDP) by means of financial, output and results indicators.
Each Managing Authority sends the Commission, by June 30th, an Annual Progress Report on the implementation of the Programme for the previous calendar year. The Annual Progress Reports include:
- a table showing the financial implementation of the Programme, providing for each measure a statement of the funds paid to beneficiaries during the calendar year (based on financial data generated by DG AGRI)
- monitoring tables which include quantitative information based on common output and results indicators.
The Commission records all monitoring data within a Rural Development Information System (RDIS). The ENRD contributes to validating the monitoring indicators and producing summary elaborations showing the state of the implementation of the RDPs at the EU27 level.
Find summary information on the implementation of the most important measures in terms of budgets and spending in the following infographics: Axis 1, Axis 2, Axis 3, Axis 4.
Financial and physical indicators at EU27 and MS level
Outputs indicators per measure at EU27 level
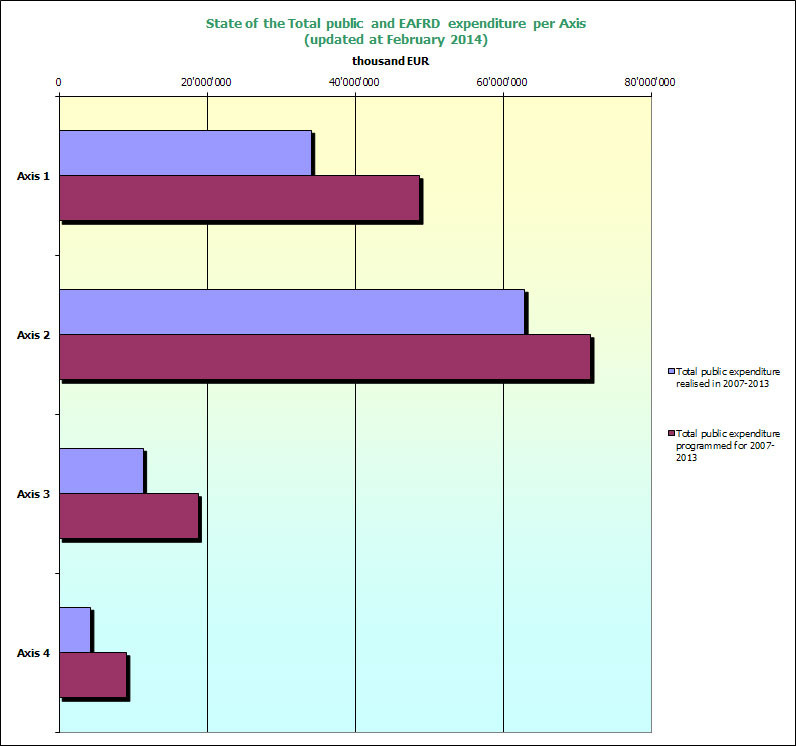

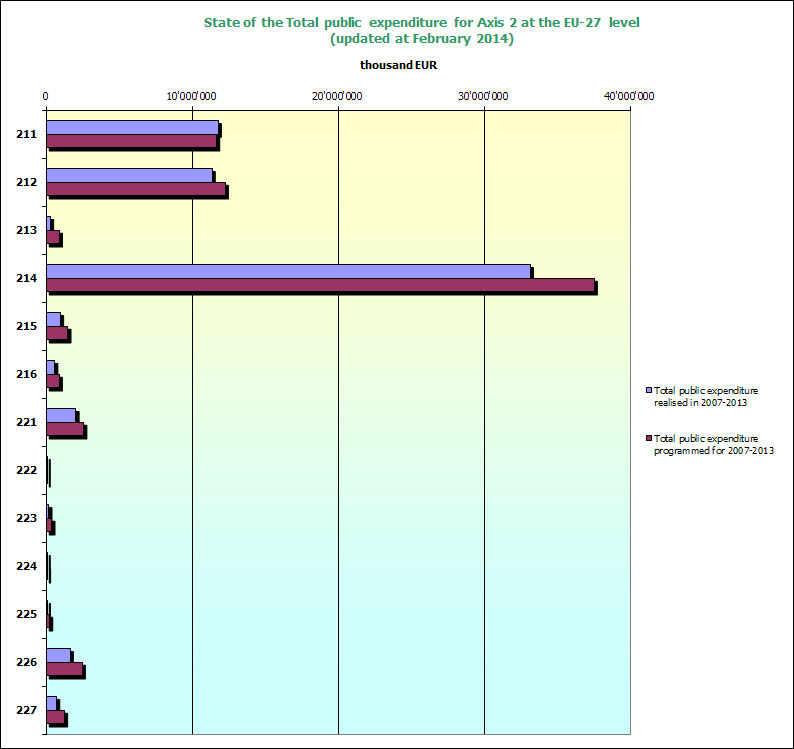
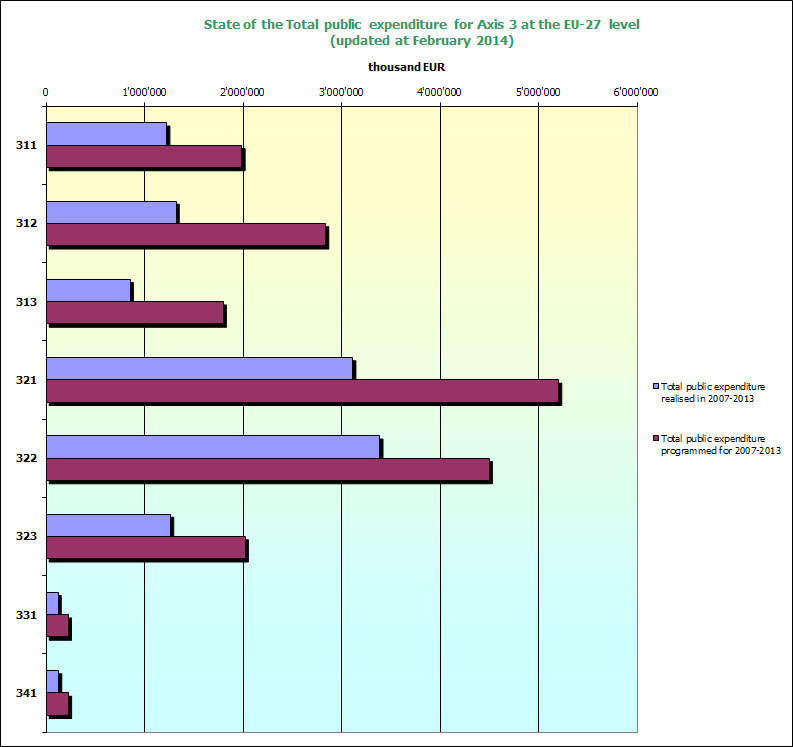
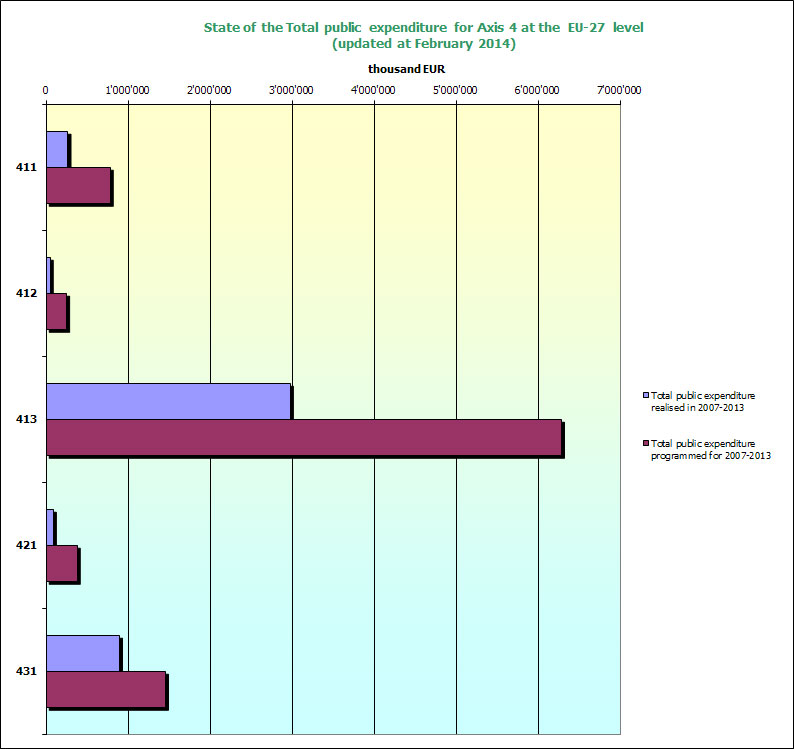
- programmed expenditures 2007-2013: RDP budget allocation following Health Check revision;
- realised expenditures 2007-2012: DG AGRI.